Oil distribution
To achieve high efficiency with a long service life, lubrication and cooling systems must be precisely designed to ensure that the required amount of lubricant is supplied at every point of a mechanical gear unit. Thus, the internal lubricant distribution is essential for a reliable and efficient gearbox.
In the FVA-Workbench, calculation of the lubricant distribution in the gearbox is based on results from FVA research project 804, in which a non-linear model was developed for simulation of the oil distribution based on an electrical resistance network. The required resistance characteristics were determined via simulation and validated with test bench measurements.
Every network starts with a pump and ends with a tank. These two components form the boundary conditions of the model, along with the selected oil and the operating temperature. Various components with resistances or branches can be located between the pump and tank. The state variables of pressure and volume flow rate before and after a component can be linked together via performance characteristics. The network can be converted into a system of equations, which is solved iteratively. After the calculation, the pressure and volumetric flow are known at every point in the network.
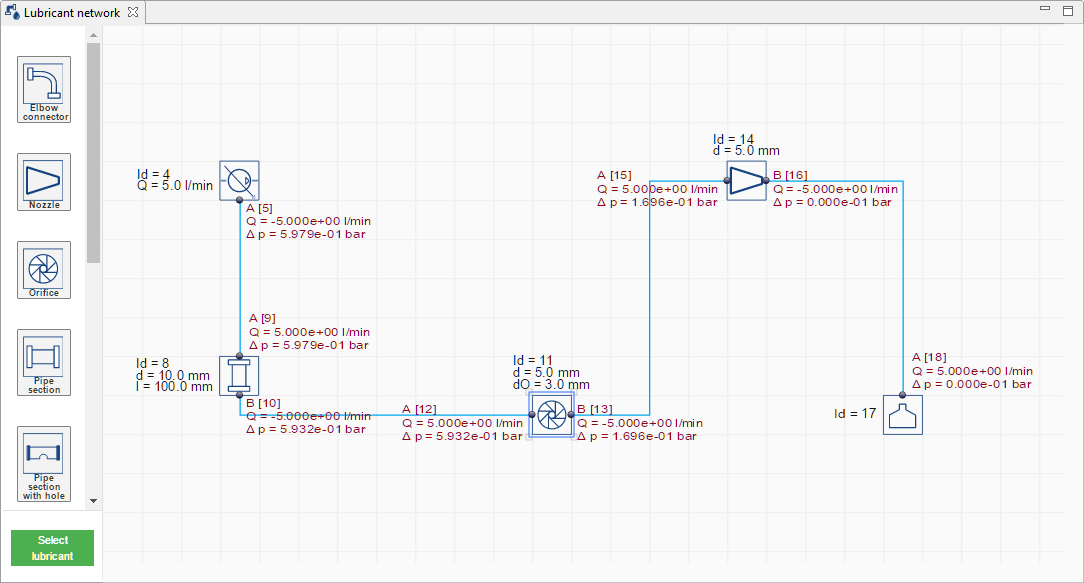
Lubricant networks can be modeled and calculated in the FVA-Workbench via a drag & drop editor.
Network components
The following components can be modeled:
Pump
Tank
Pipe section
Pipe with open bore
Aperture
Nozzle
Angle
Drilled corner piece
T-piece
User-defined resistance curve
Input parameters
The following parameters are required for calculating the lubricant distribution:
Structure of the lubricant network
Selection of the lubricant
Specification of the pump pressure and lubricant temperature
Geometric parameters of all components
Specification of the operating conditions
The operating conditions are defined by specifying the pump pressure and the lubricant temperature. This determines the density and viscosity of the specified lubricant under operating conditions.
Geometric parameters and resistance curves of the components
The geometry of the assembled components (e.g., the diameter and length of a pipe section) must be specified for the calculation. Resistance curves were created for the component types in the library in FVA Research Project 804. The calculation can determine the corresponding pressure loss coefficient based on the specified geometry and the flow conditions. The resistance curves of the components link the flow conditions (characterized by the Reynolds number of the fluid) to the resistance coefficient.
Determination of the fluid characteristics
The viscosity and density relative to the current temperature are required for the calculation of dimensionless parameters which are used for the resistance curves.
Measured values for the viscosity and density of different oils in a temperature range from -10°C to 70°C are available in the FVA-Workbench database. The corresponding viscosity and density are taken from the database, depending on the selected oil and the temperature.
Ideally, the fluid characteristics of the lubricant should be known. Select lubricants were measured as part of FVA 804.
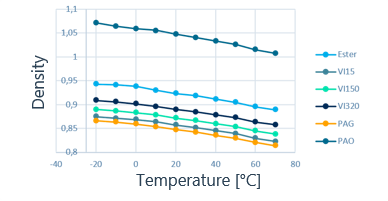
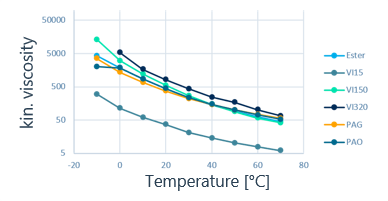
Characteristic curves for density and viscosity as a function of the lubricant temperature
The relevant characteristic curves for the density and viscosity as a function of the lubricant temperature are stored in the Global Database. Custom measurements can also be saved in the database. If the fluid characteristic is not more precisely specified, it is calculated from the specified density using the viscosity of the lubricant at 40° and 100°C.
Flow resistance
The flow resistance of the individual components was determined using CFD. Simulations were performed for each component with volume flows of 0 l/min ≤ V ≤ 10 l/min and temperatures of -10°C ≤ T ≤ 70 °C. The viscosity and density were selected from the previously determined fluid characteristics based on the oil and the temperature. The result of the simulations is the pressure loss of each component as a function of the selected boundary conditions. The CFD calculations were cross-validated on a test bench.