Tables
Table types
A Report Template consists of one or more sections. Outputs for the respective machine elements can be defined in each section. Different types of tables can be used, depending on the section.
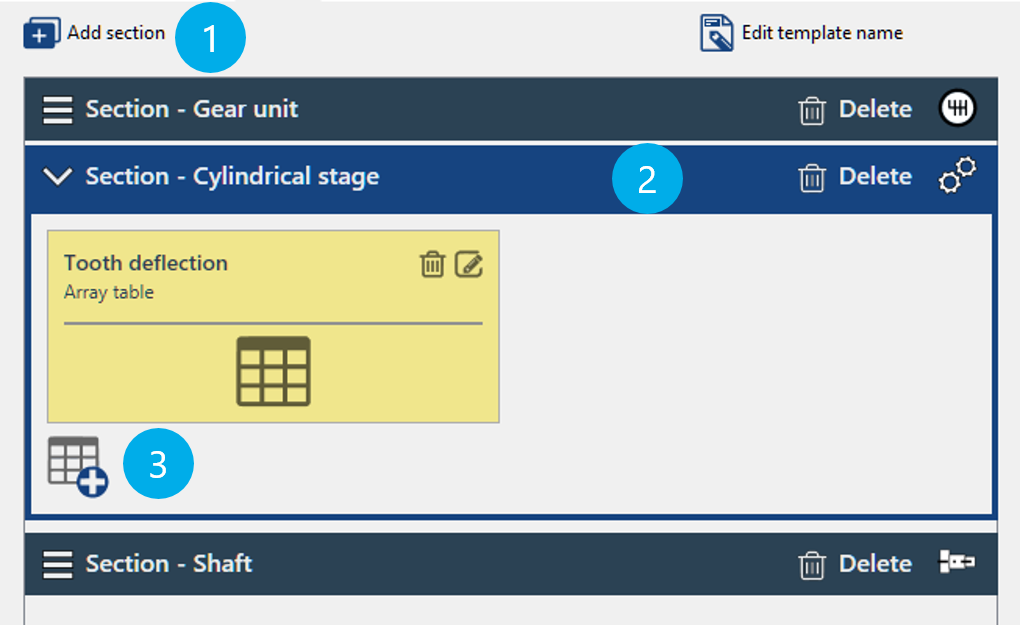
(1) Adds a new section, such as shaft.
(2) Inserted Cylindrical Stage section.
(3) Adds a new table to the section.
Table type | Example | Description |
|---|---|---|
Attribute table | 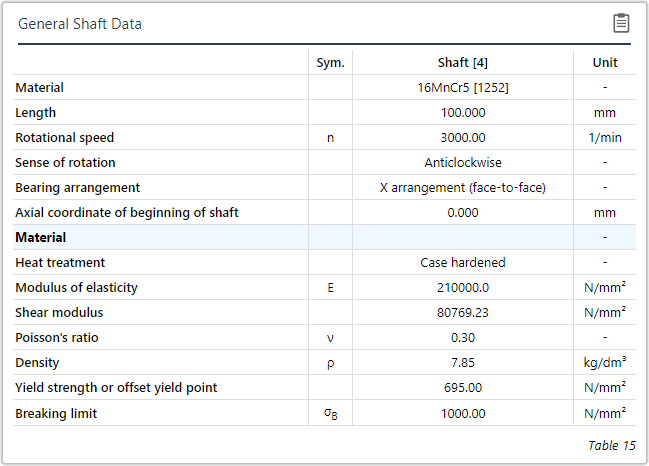 | This type of table can be used to show attributes for the section component type and associated components. Example Table in the "shaft" section that includes attributes for the shaft and material. |
Overview table | 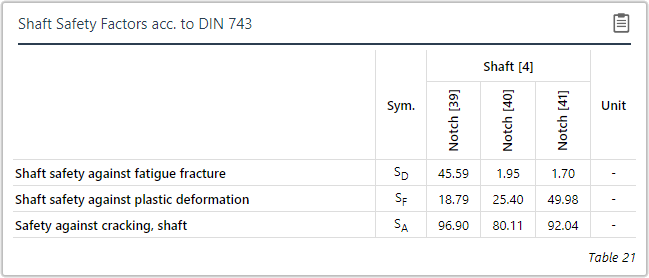 | This type of table can be used to display attributes for multiple components of a type. Example Table in the Shaft section that includes attributes of all notches. |
Grouped overview table | 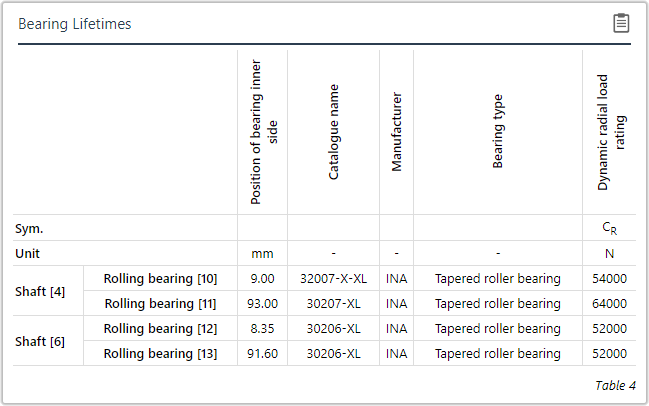 | This type of table can be used to display attributes of components and their sub-components. Example Table in the Gear Unit section in which attributes for all rolling bearings are displayed, grouped by the shaft on which they are mounted. |
Array table | 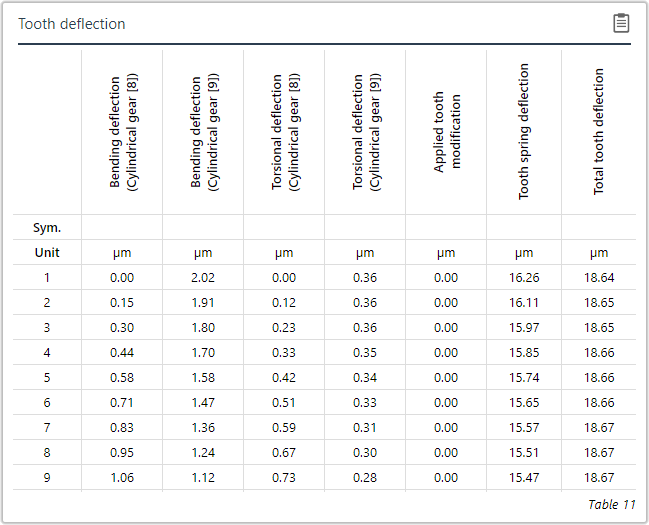 | This type of table can be used to display array attributes of the section component type. Example Table in the Cylindrical Gear Stage section in which multiple array attributes related to gear deformation are displayed. |
Matrix table | 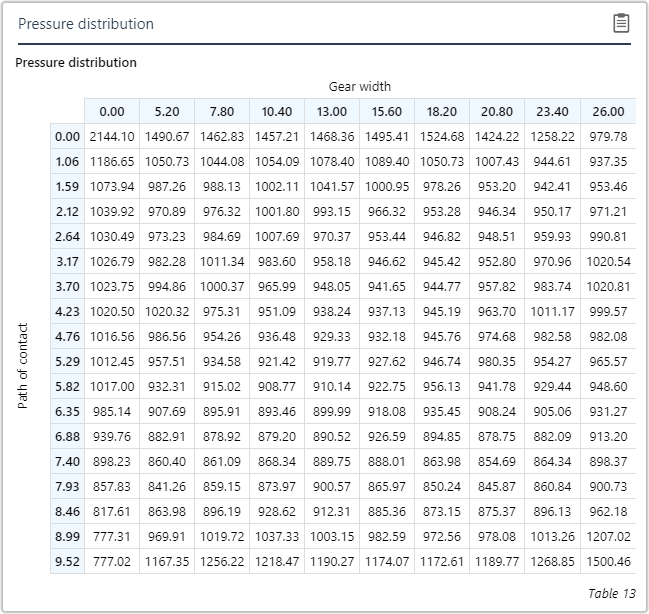 | This type of table can be used to display matrix attributes of the section component type. Example Table in the Cylindrical Gear Stage section, in which the pressure distribution on the flank is displayed. NoticeThis type of table cannot be modified. |
Editing tables
The Report Configurator includes several options for customizing the content of tables:
Add attributes
Add custom text
Show/hide tables depending on an attribute value
Highlight cells in red depending on a pre-defined interval
Sort table entries depending on an attribute value
Adding attributes
Calculation and input attributes can be added to tables in the Report Configurator.
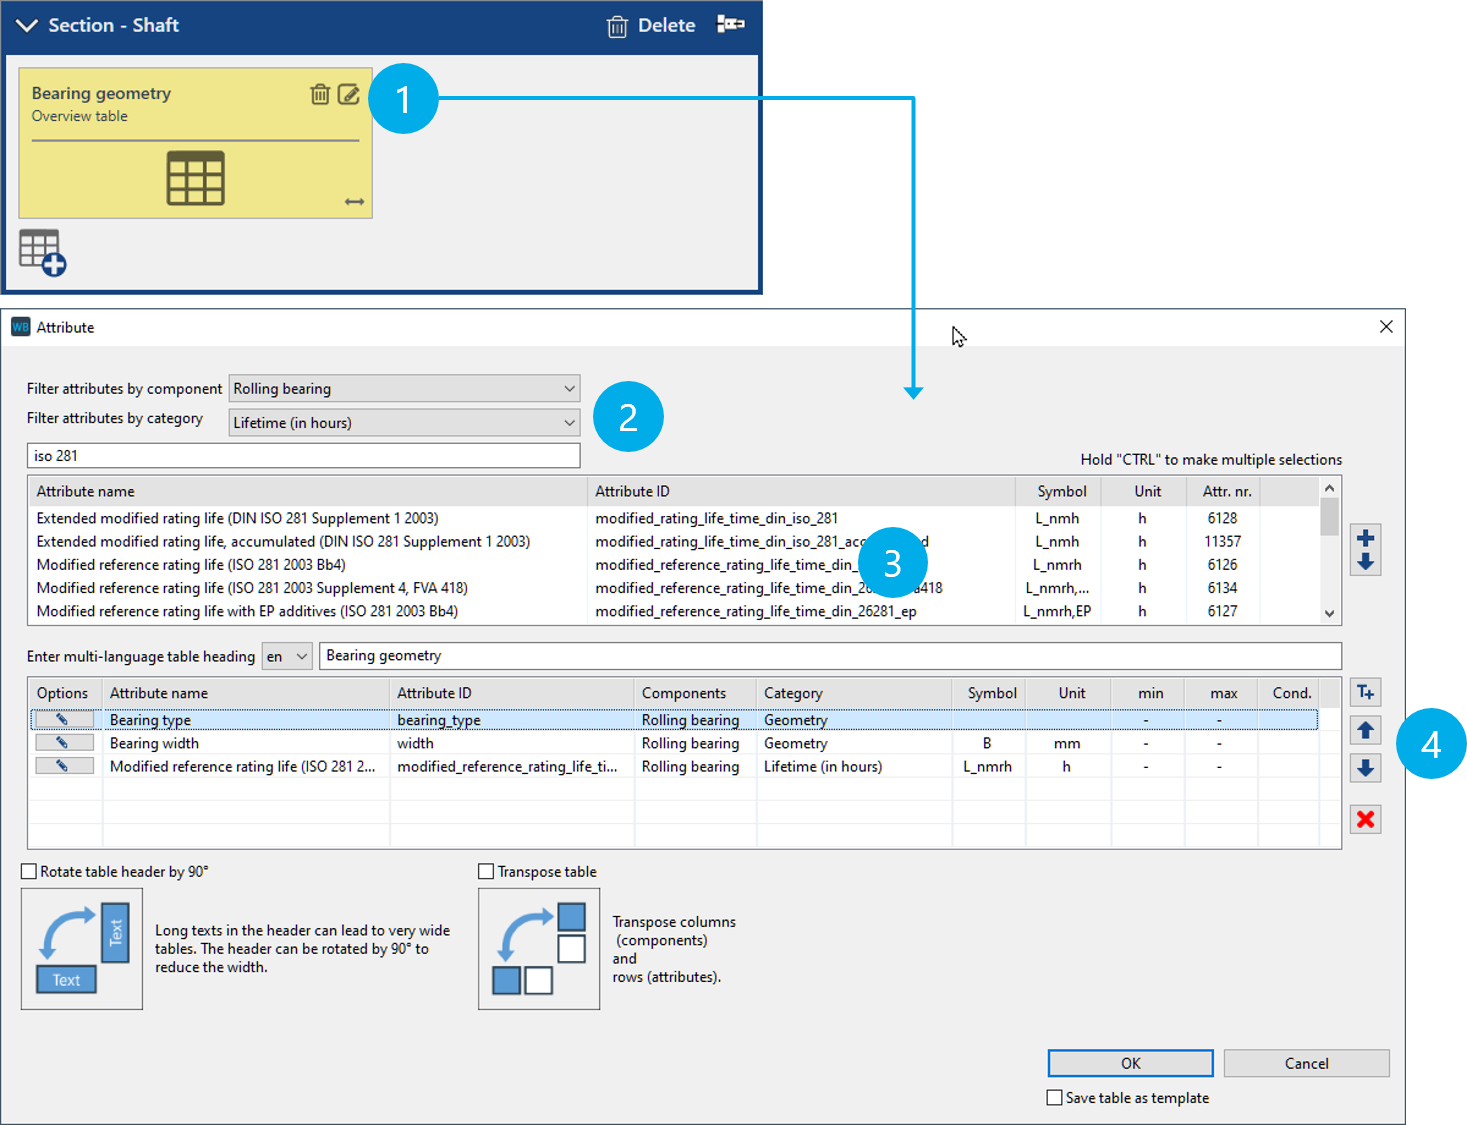
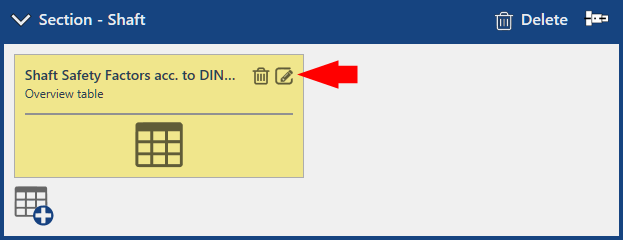
(1) Click the pen icon to open the table configuration dialog.
(2) Attributes can be filtered by selecting a component or category.
(3) Double-click an entry to add the attribute to the table.
(4) Use the arrow to change the order of the attributes within the table.
Adding custom text and notes
Add custom text to a table
Custom text is displayed in a table like an attribute, and consists of the title and the actual text. It can be used, for example, to add sub-headings or notes to a table. The text can be entered in multiple languages. The report will then show the language in which the report was generated. This feature can be used in all table types except for matrix tables.
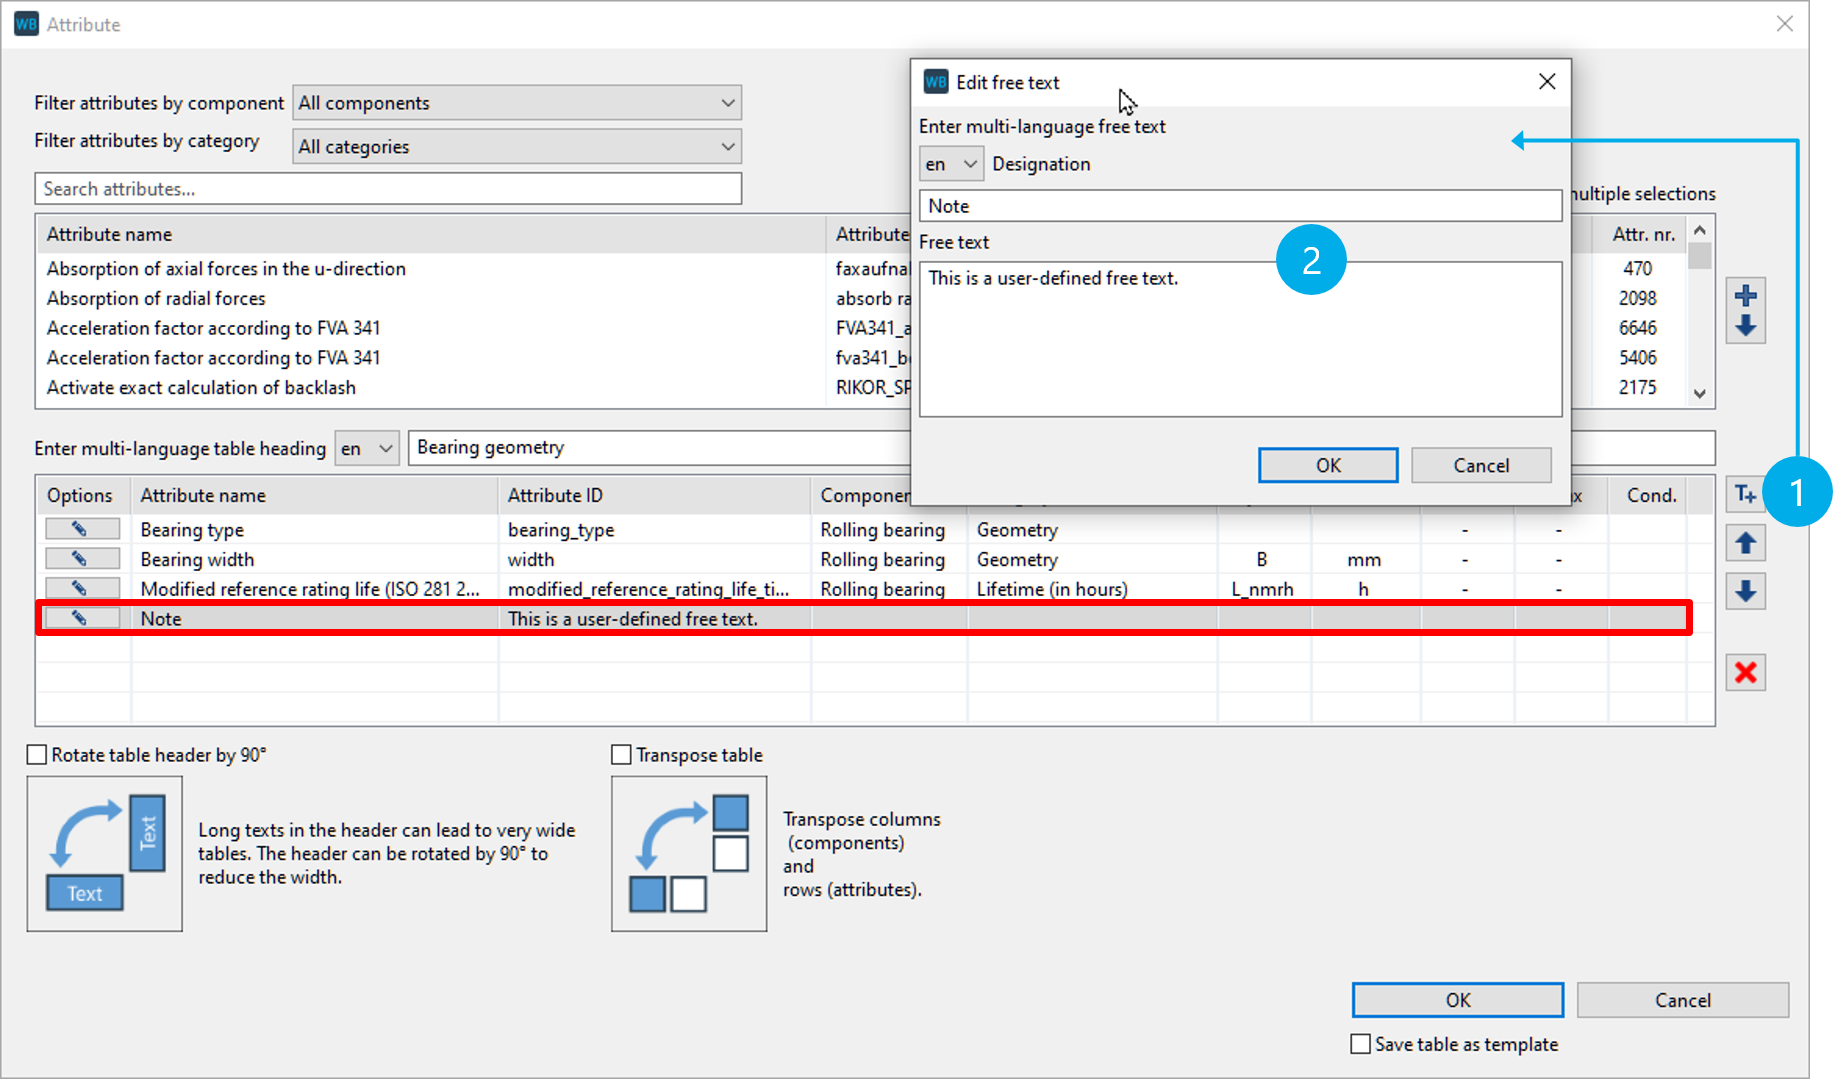
(1) Click the icon to add custom text.
(2) Custom text can be entered in multiple languages.
Adding component notes to a table
In contrast to custom text, component notes are component-specific. Component notes are saved in attributes and can be added to a table like other calculation attributes. The following notes can be specified:
Component note | Attribute ID |
|---|---|
Drawing number | comp_drawing_number |
Identification number | comp_ident_number |
Component remarks | comp_remarks |
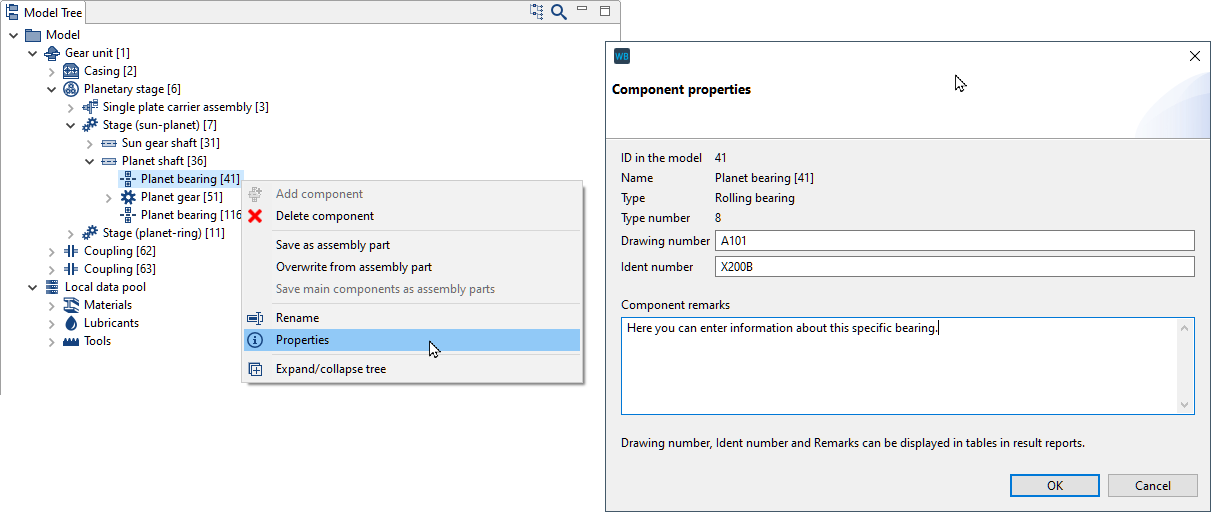
Component-specific information, such as chart numbers or technical notes, can be entered by right-clicking in the Model Tree and choosing Properties.
Dynamically show/hide tables
Depending on the calculation, it may be useful to not include a table in a report. Instead of removing the table from the report template, an attribute can be defined as a visibility toggle for each table. A reference value can then be specified with which the calculated attribute value is compared. As soon as the specified condition is met, the table is included in the report. This feature can only be used in attribute tables.
Condition | Table will be shown, if: |
|---|---|
= | the attribute value matches the specified value. |
!= | the attribute value does not match the specified value. |
< | the attribute value is less than the specified value. |
<= | the attribute value is less than or equal to the specified value. |
> | the attribute value is greater than the specified value. |
>= | the attribute value is greater than or equal to the specified value. |
!=null | the attribute is not blank (not calculated). |
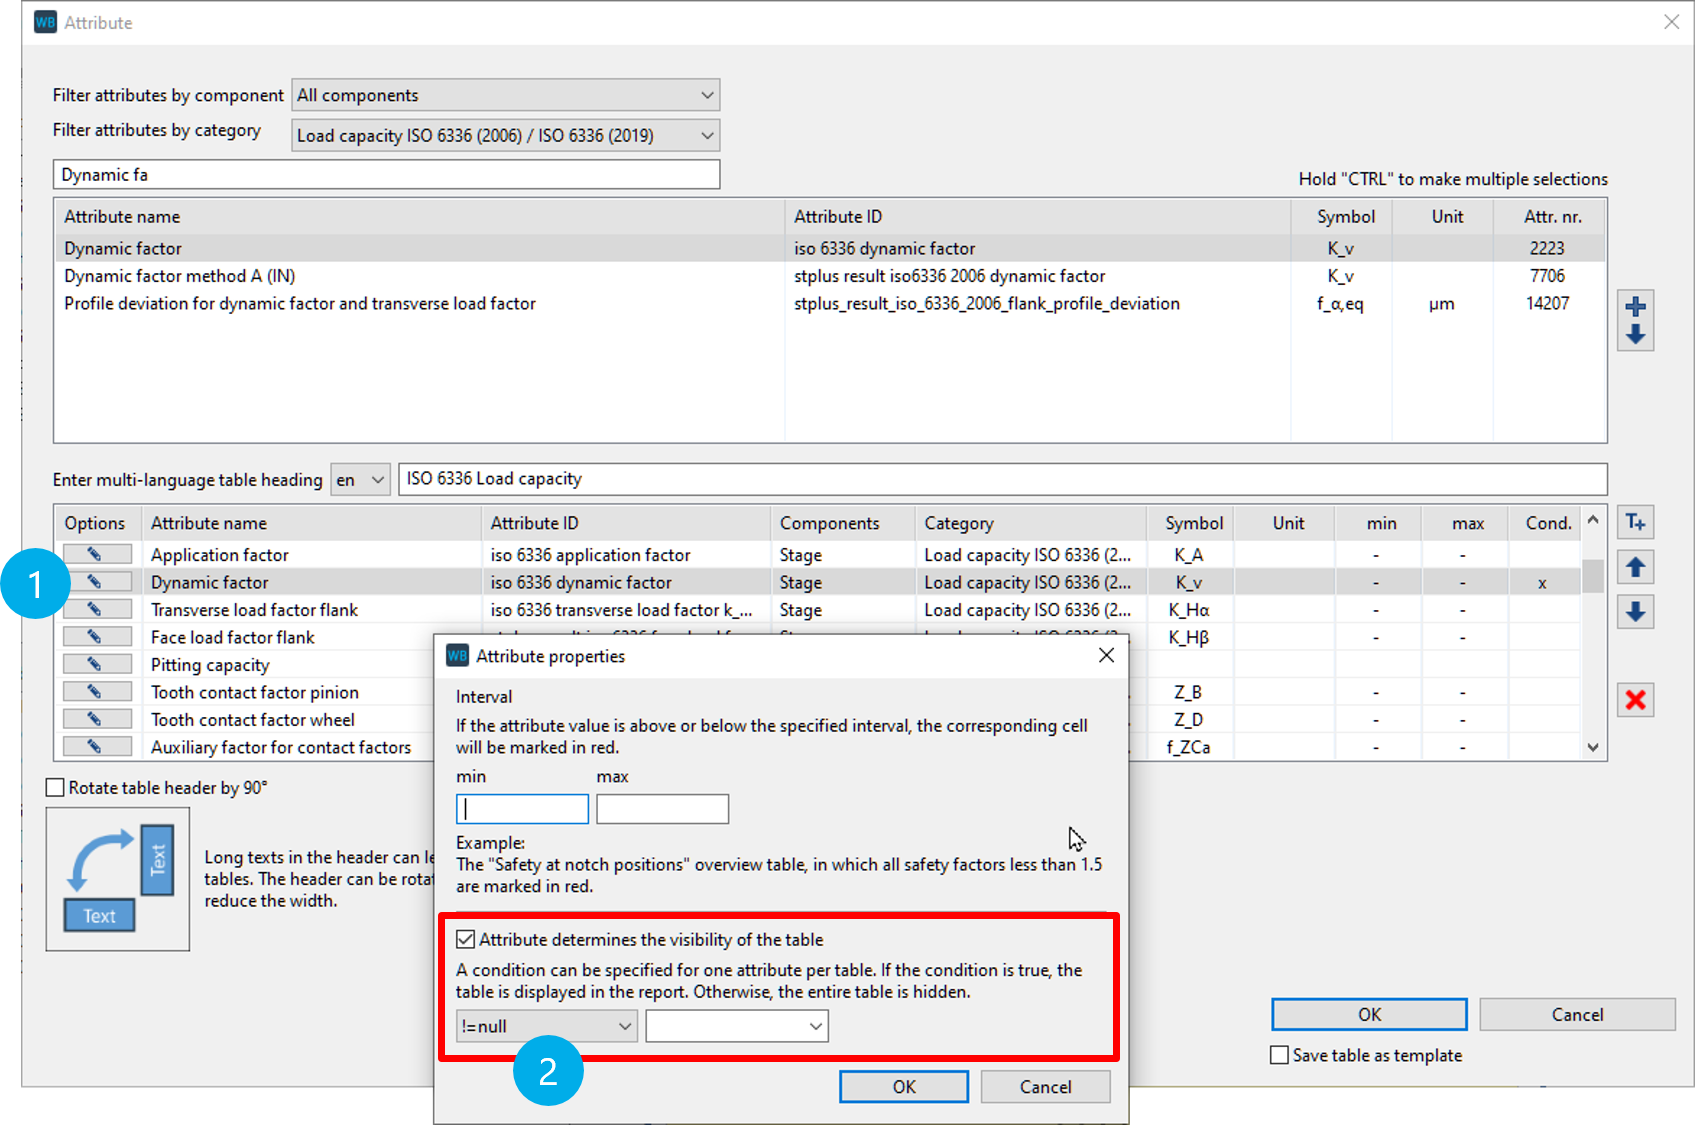
(1) Right-click on the pen icon next to an attribute to open the dialog.
(2) Select the condition from the drop-down menu and then specify a reference value in the corresponding input field.
Highlighting cells
Table cells can be highlighted in red to make critical values easy to detect in a report. To do this, an interval is specified. If the attribute value exceeds or falls below the interval limits, the cell is highlighted in red. This feature can be used in all table types other than matrix tables.
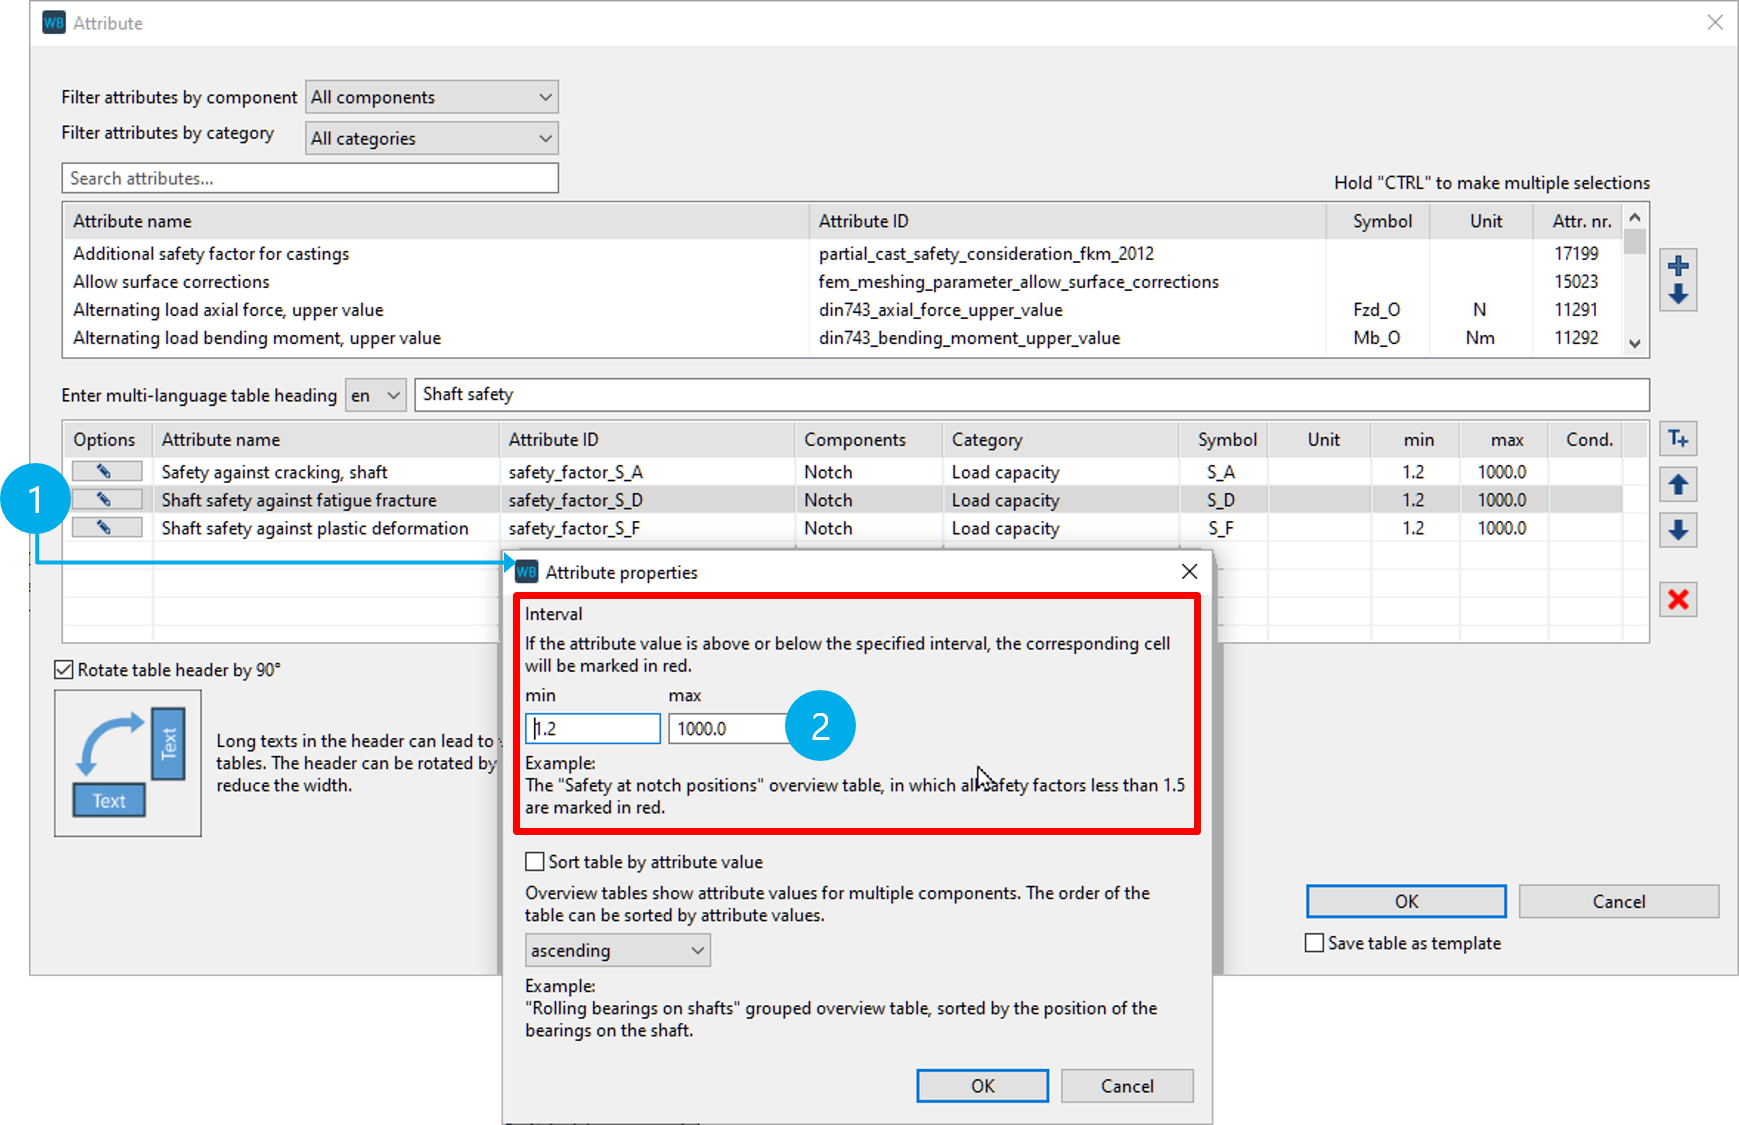
(1) Click the pen icon next to an attribute to open the dialog.
(2) Input fields for the interval [1.2, 1000]. Values outside this interval are highlighted in red.
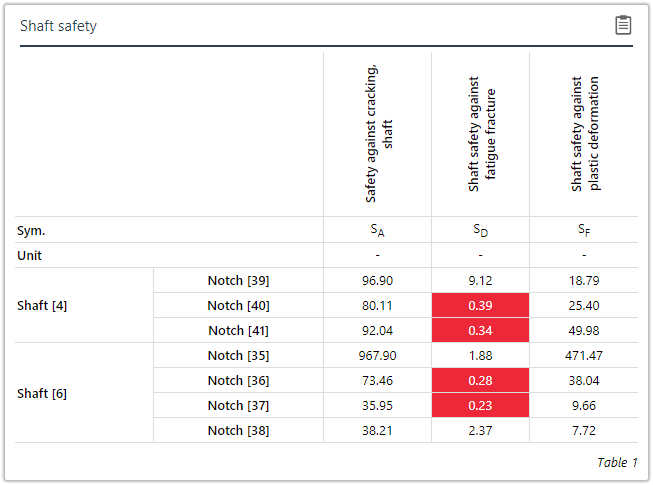
Grouped overview table in which all safety values less than 1.2 are highlighted in red.
Sorting tables
Attributes for multiple components are shown grouped according to parent components in overview tables and grouped overview tables. The order in which the components are listed can be sorted according to an attribute.
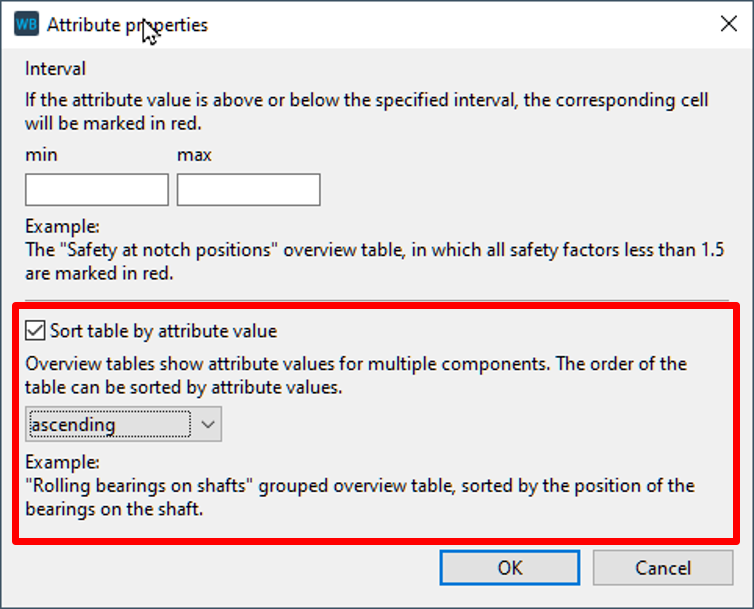
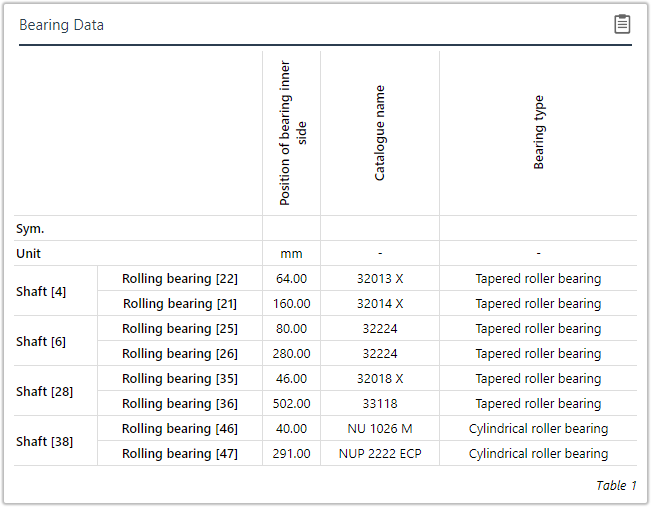
Grouped overview table in which the rolling bearings are sorted in ascending order according to their position.
Table layout
The layout of tables can be modified in the Report Configurator. A table can be transposed and the table header can be rotated by 90°. When transposed, the rows (attribute names) and columns (component names) are swapped. Both options can be helpful to show all of a table if it becomes too wide.
The table layout can be modified in the Report Configurator.
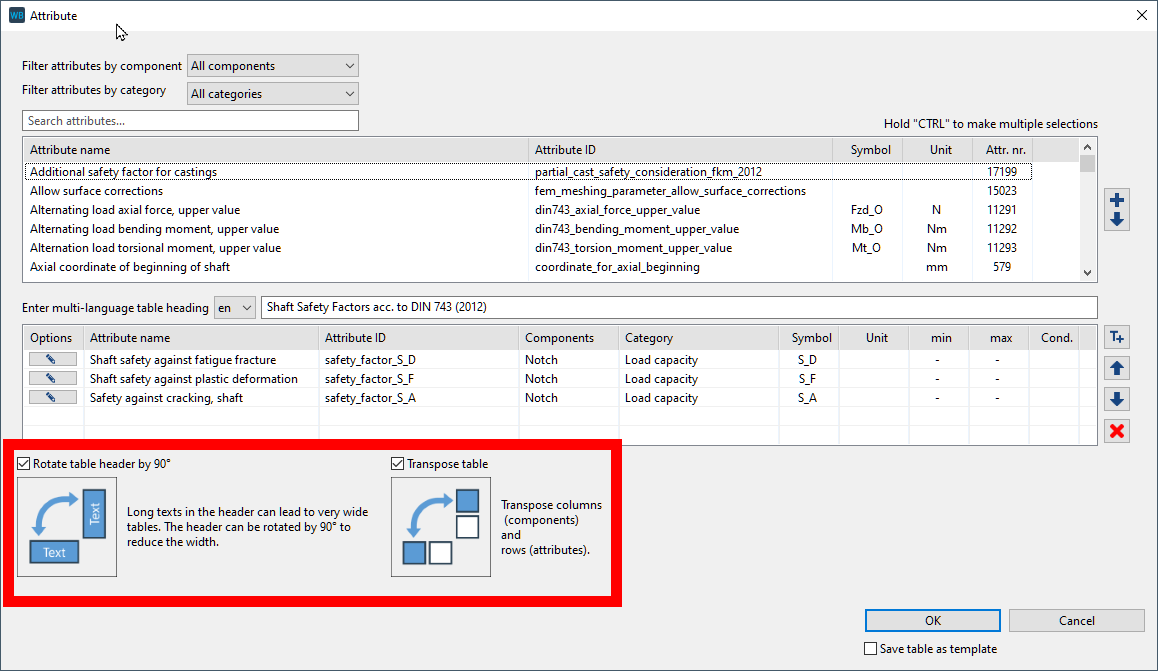
The header row of a table can be rotated by 90° or the entire table can be transposed by ticking the checkboxes.
The results of the "transpose" and "rotate table header by 90°" layout options.