Diagrams
A report template consists of one or more sections. The outputs for every machine element can be defined in each section. Various diagrams can be used, depending on the section.
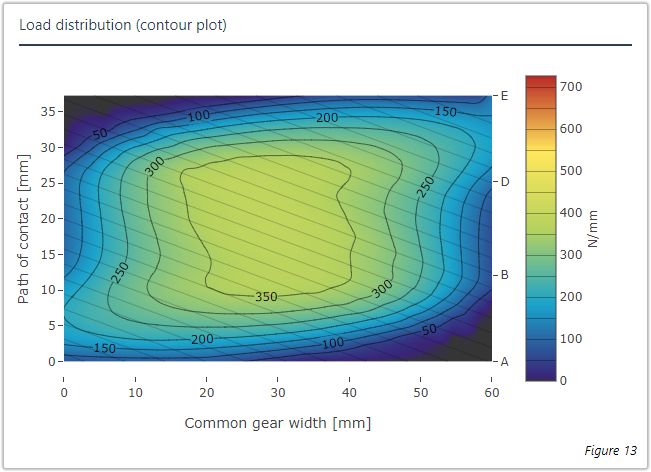
Representation of the pressure distribution of a cylindrical gear flank
Configuring diagrams
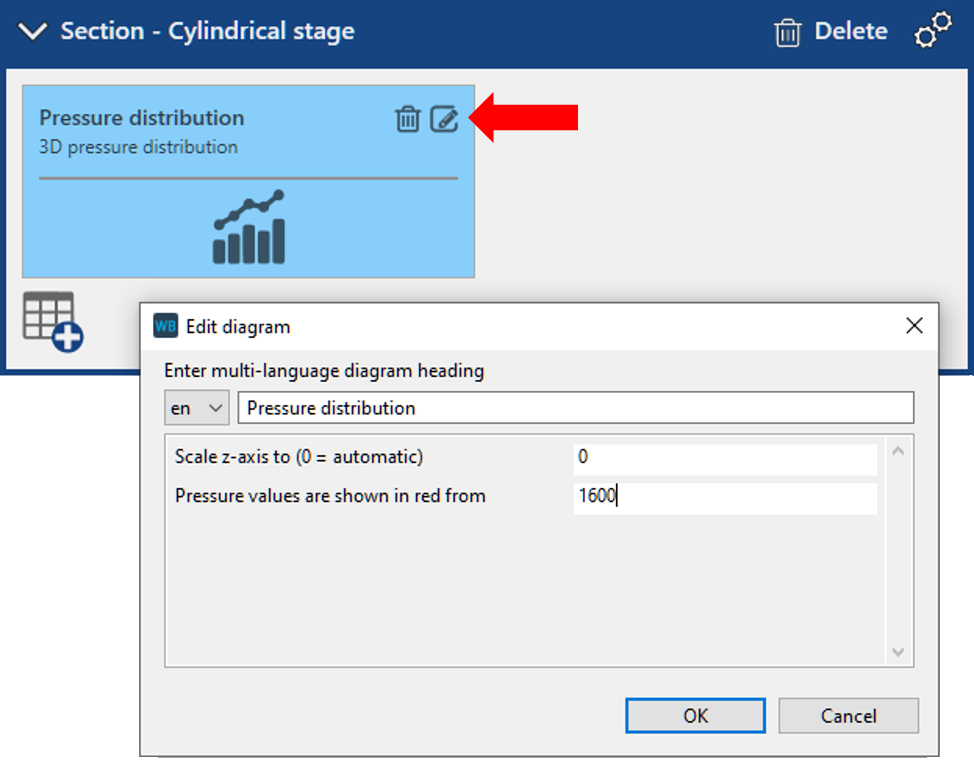
The diagram header can be customized in German and English. Some diagrams have additional configuration options, such as scaling and color, in order to quickly identify differences in the calculation results, especially when comparing reports.
Examples
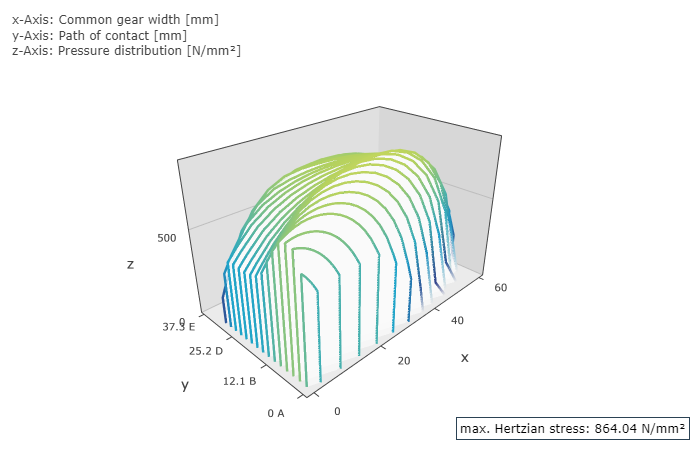
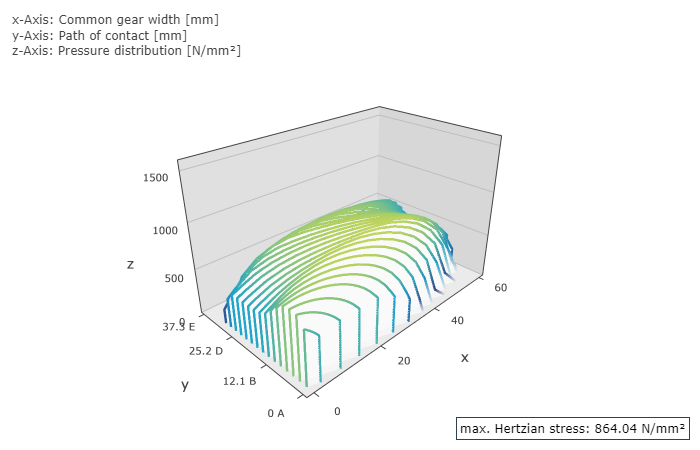
Pressure distribution diagram with automatic scaling (left) and scaled to 1600 N/mm² (right).
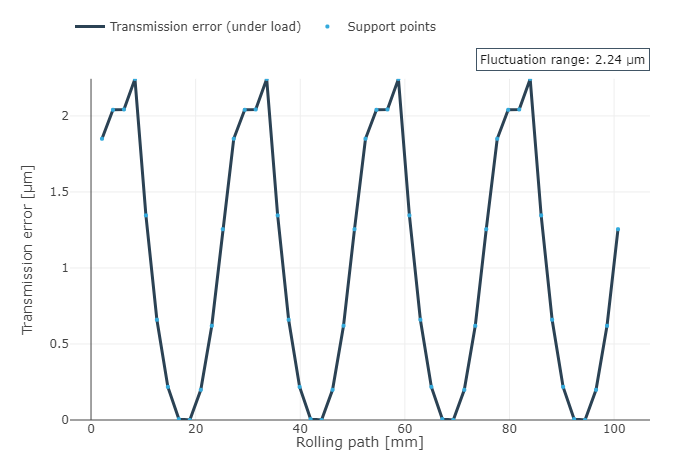
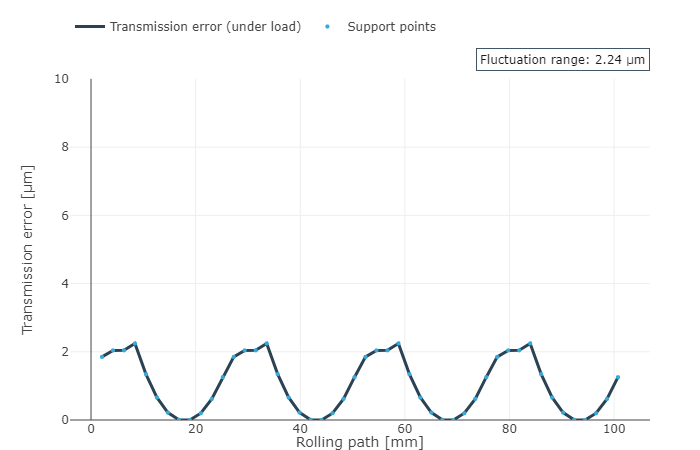
Transmission error diagram with automatic scaling (left) and scaled to 10 µm (right).
User-defined diagrams
User-defined diagrams can display any data series in various diagram types. The associated data is stored in user-defined attributes. Every component in the gearbox model features a set of these attributes, including arrays and double attributes. The data is prepared and saved in user-defined attributes in the FVA-Workbench Scripting feature.
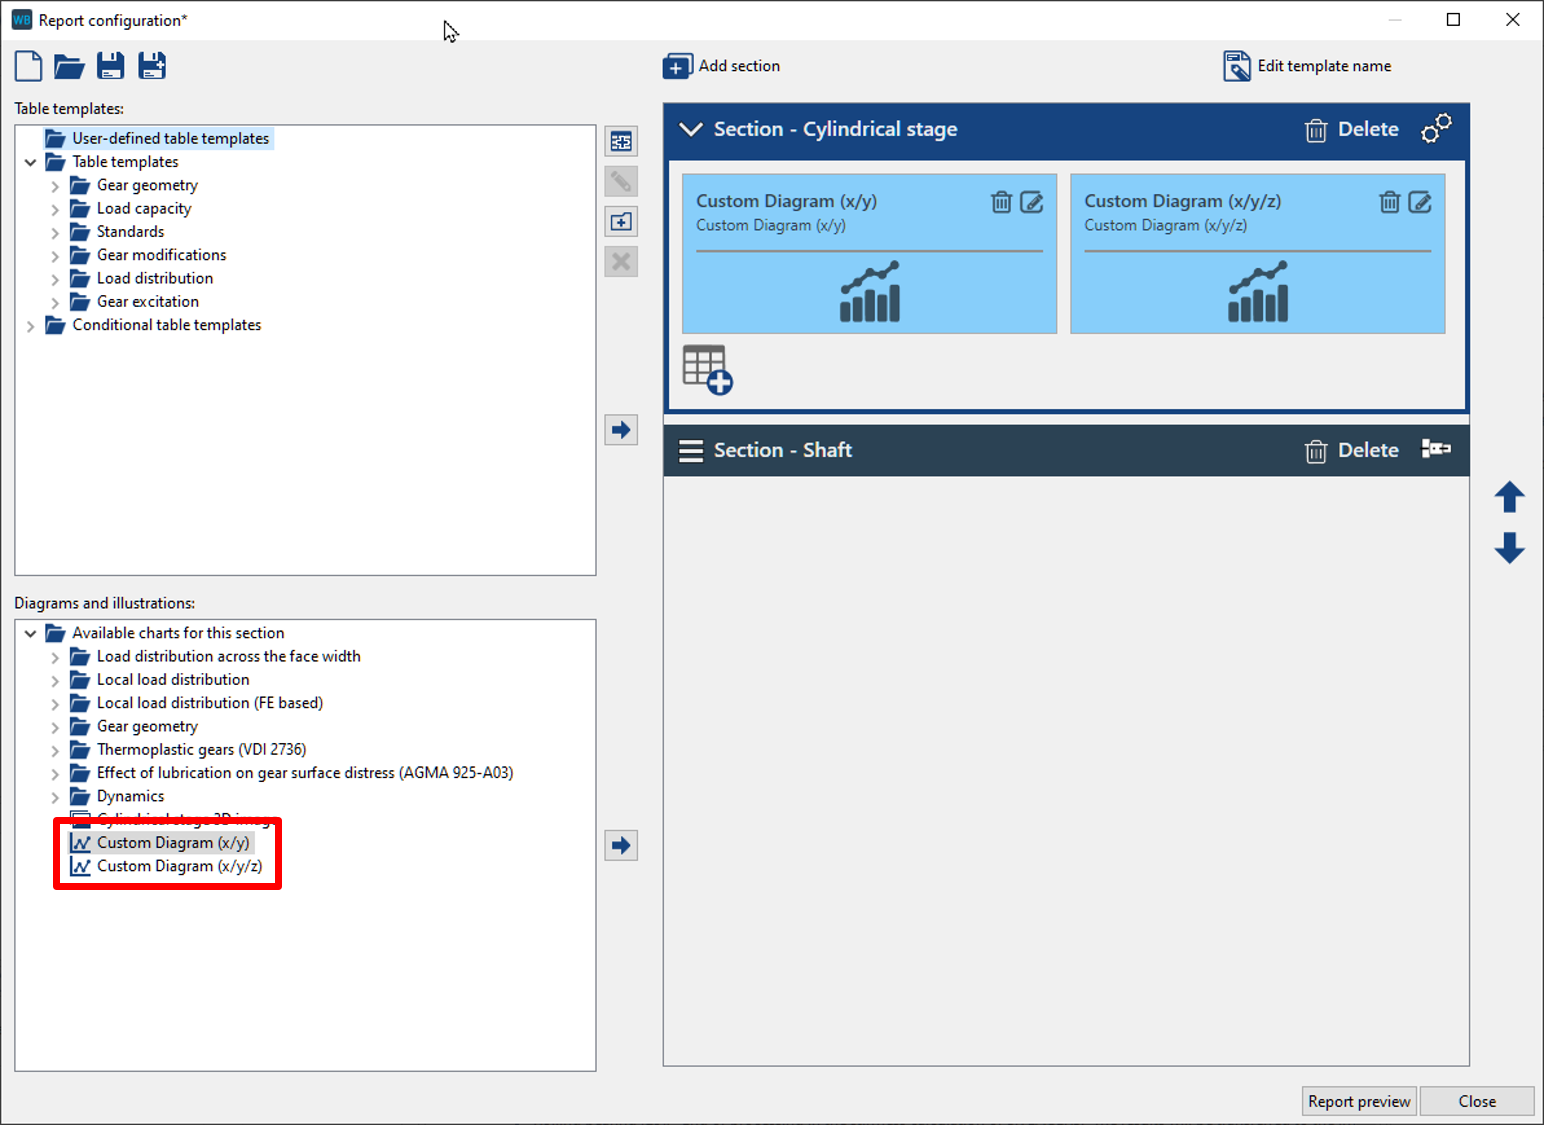
User-defined diagrams for each section are available in the Report Configurator.
Attribute ID | Data type | Number per component |
|---|---|---|
custom_attribute_double_1 | Double | 8 |
custom_attribute_array_1 | Array | 12 |
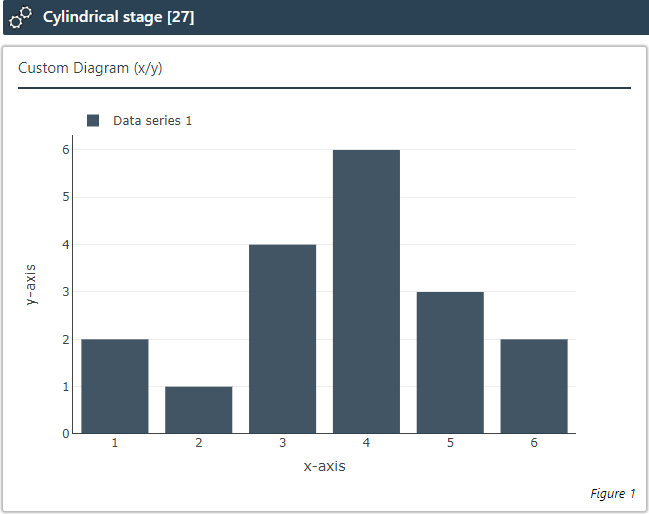
Example: assigning two user-defined attributes to a cylindrical gear stage with arrays
let stageID = 27;
let array_x = [1,2,3,4,5,6];
let array_y = [2,1,4,6,3,2];

setAttr("custom_attribute_array_1", stageID, array_x, EDAT);
setAttr("custom_attribute_array_2", stageID, array_y, EDAT);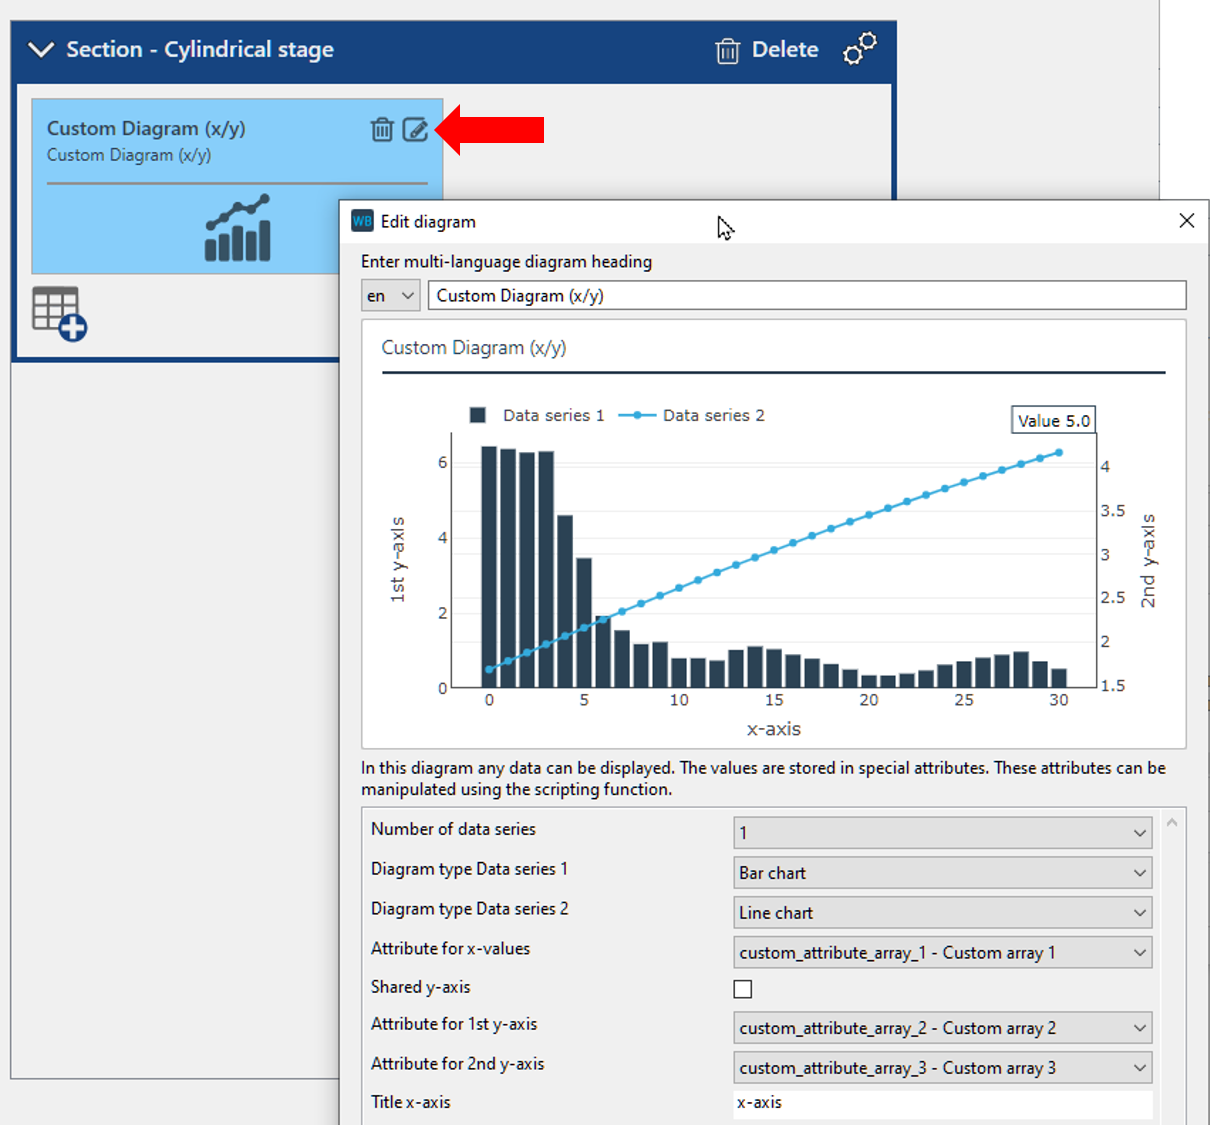
The attributes used and the appearance of the diagrams can be customized in the Report Configurator.
Notice
User-defined diagrams are not shown in the report preview.