Rotating Rainflow Calculation
Gears are subjected to homogeneous and heterogeneous alternating loads due to their design and operating conditions. In practice, the typical load cases are usually known, but the exact sequence is generally unavailable and often not meaningful to specify as a deterministic load-time series. However, this sequence is a key factor: when operating conditions are considered in their temporal order rather than in isolation, additional and often higher stresses arise than would be expected from a purely linear accumulation by state.
Rotating Rainflow postprocessing according to FVA 1053 addresses this by constructing a representative load sequence from a flexible load spectrum and a transition matrix. This sequence is then broken down to the level of local tooth root stresses and converted into a stress spectrum that can be interpreted in terms of material behavior using Rainflow counting. The goal is to evaluate variable operating states within the framework of ISO 6336 while considering sequence effects and mean stress influences more consistently than a purely collective analysis with global factors.
Symbols
Symbol | Description |
|---|---|
σo | upper reversal point of an oscillation |
σu | lower reversal point of an oscillation |
σa | stress amplitude |
σm | mean stress |
R | stress ratio |
M | mean stress sensitivity (slope of Haigh diagram) |
n | number of cycles of a quasi-steady stress segment within an operating condition |
Calculation process
The following calculations are performed during the Rotating Rainflow postprocessing step of the FVA-Workbench system calculation:
Synthetic stress profiles at the tooth root for each load case
Reconstruction of a load sequence from a Rainflow transition matrix
Total stress-time history and Rainflow counting
Mean stress transformation in the Haigh diagram
Damage accumulation acc. to ISO 6336
Synthetic stress profiles at the tooth root for each load case
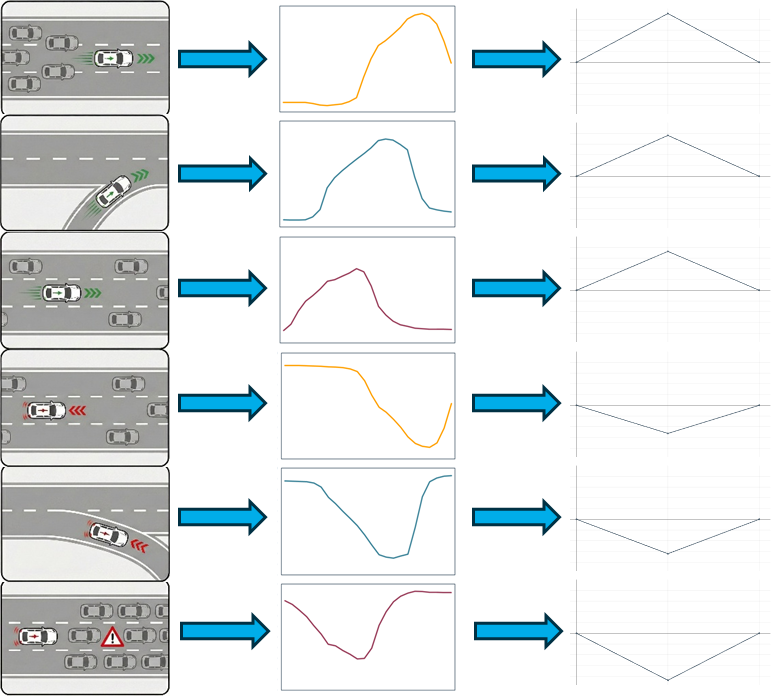
Rainflow counting requires a time-ordered sequence of reversal points of discrete stress values. Since the flexible load spectrum initially consists of discrete load cases, an idealized stress profile of a tooth mesh is synthesized for each load case. The tooth root stress, re-evaluated at the 30° tangent according to ISO 6336, is used for this purpose
It is also important that the driving flank is clearly defined for each load case. The "active" side changes with direction changes or sign reversals, resulting in different local signs and mean stresses at the tooth root. The method uses information from the power flow analysis or load case direction to consistently represent the tensile and compressive components in the signal.
There is one critical assumption for the compressive side: a stress value is applied at the 30° tangent for the compressive side of the loaded tooth, corresponding to -1.2 times the tensile tooth root stress [Brin 89]. This provides the synthetic profile for each segment with both a tensile pulsation and an alternating component that matches the real loading condition.
This creates a discrete reversal point signal of a "condition segment" for each load case.
Reconstruction of a load sequence from a Rainflow transition matrix
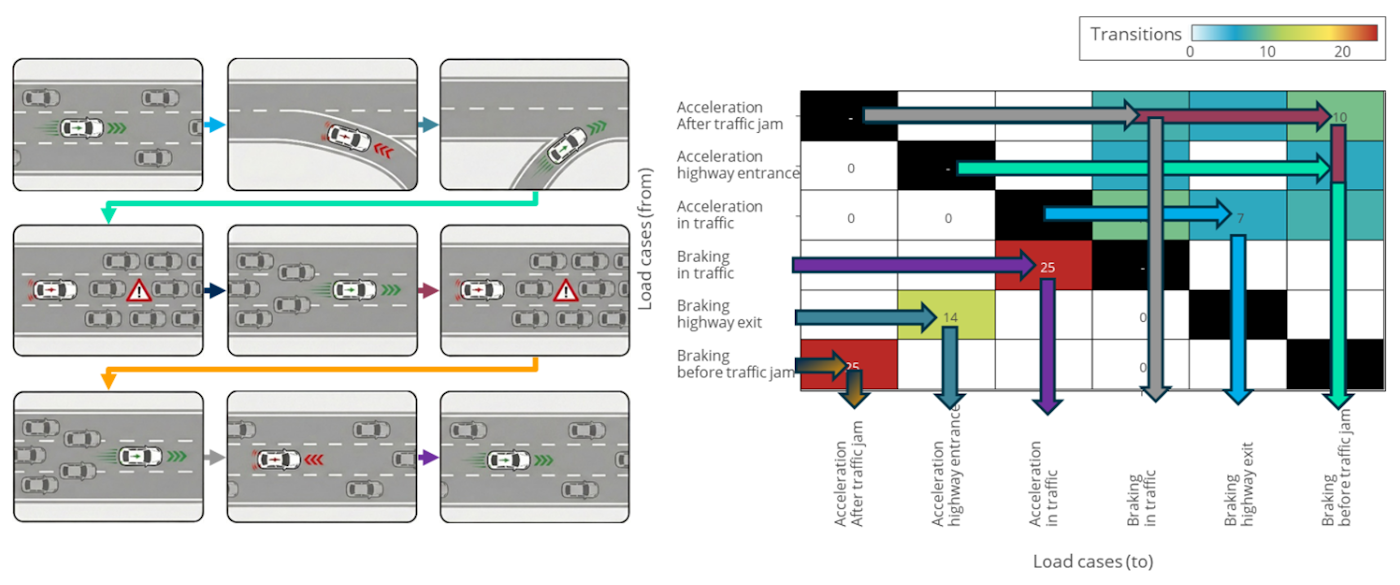
The starting point of the method is a transition matrix that describes how often transitions occur between operating states. Conceptually, this is not a "probability matrix" in the sense of an abstract Markov model, but rather a description of transitions over the considered lifetime that can be used operationally. A matrix element 𝑁𝑖→j represents how often operating state 𝑖 directly follows operating state 𝑗 during the lifetime. This stores the sequence information in a compact form. A load spectrum specifies which conditions occur and their intensity; the transition matrix complements this by defining the typical sequence in which these states occur.
For gears, this sequence information is particularly important when load signs change ("pulling" and "pushing" operations) or when states involve significantly different torque. In these cases, a stress condition arises at the tooth root that is not simply "high" or "low," but instead features systematically shifting tensile and compressive stress components, as well as mean stress levels, depending on the sequence. The procedure specifically addresses this and constructs a loading-time series that explicitly includes these transitions.
A pseudo-random sequence of operating states is generated from the transition matrix, fulfilling the frequencies defined in the matrix. In this context, "pseudo-random" means that the sequence appears random, but is constructed such that transition counts from the matrix are accurately reproduced. The algorithm used in the methodology is based on the work of Fischer et al. [Fisc 77], and can be understood as operating row-by-row with random numbers to select the next state according to the specified transition frequencies. In practice, the entries in the current row are processed one by one until the transition is determined. This process is repeated until the matrix conditions are satisfied. A key constraint for practical application is the requirement that the transition description must remain consistent. If a state appears only as a "destination" with no outgoing transitions, or if subsets of states are isolated from one another, it is not possible to generate a complete series that satisfies all frequency conditions.
In the Workbench, the results can be reproduced with identical inputs; i.e., the same transition matrix and load spectrum always generate the same load sequence.
Total Stress-Time History and Rainflow Counting
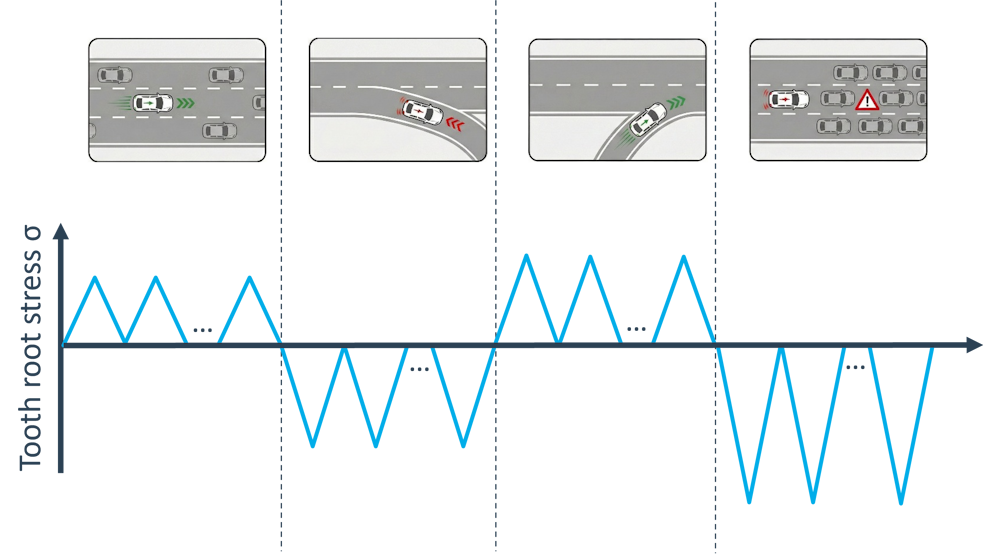
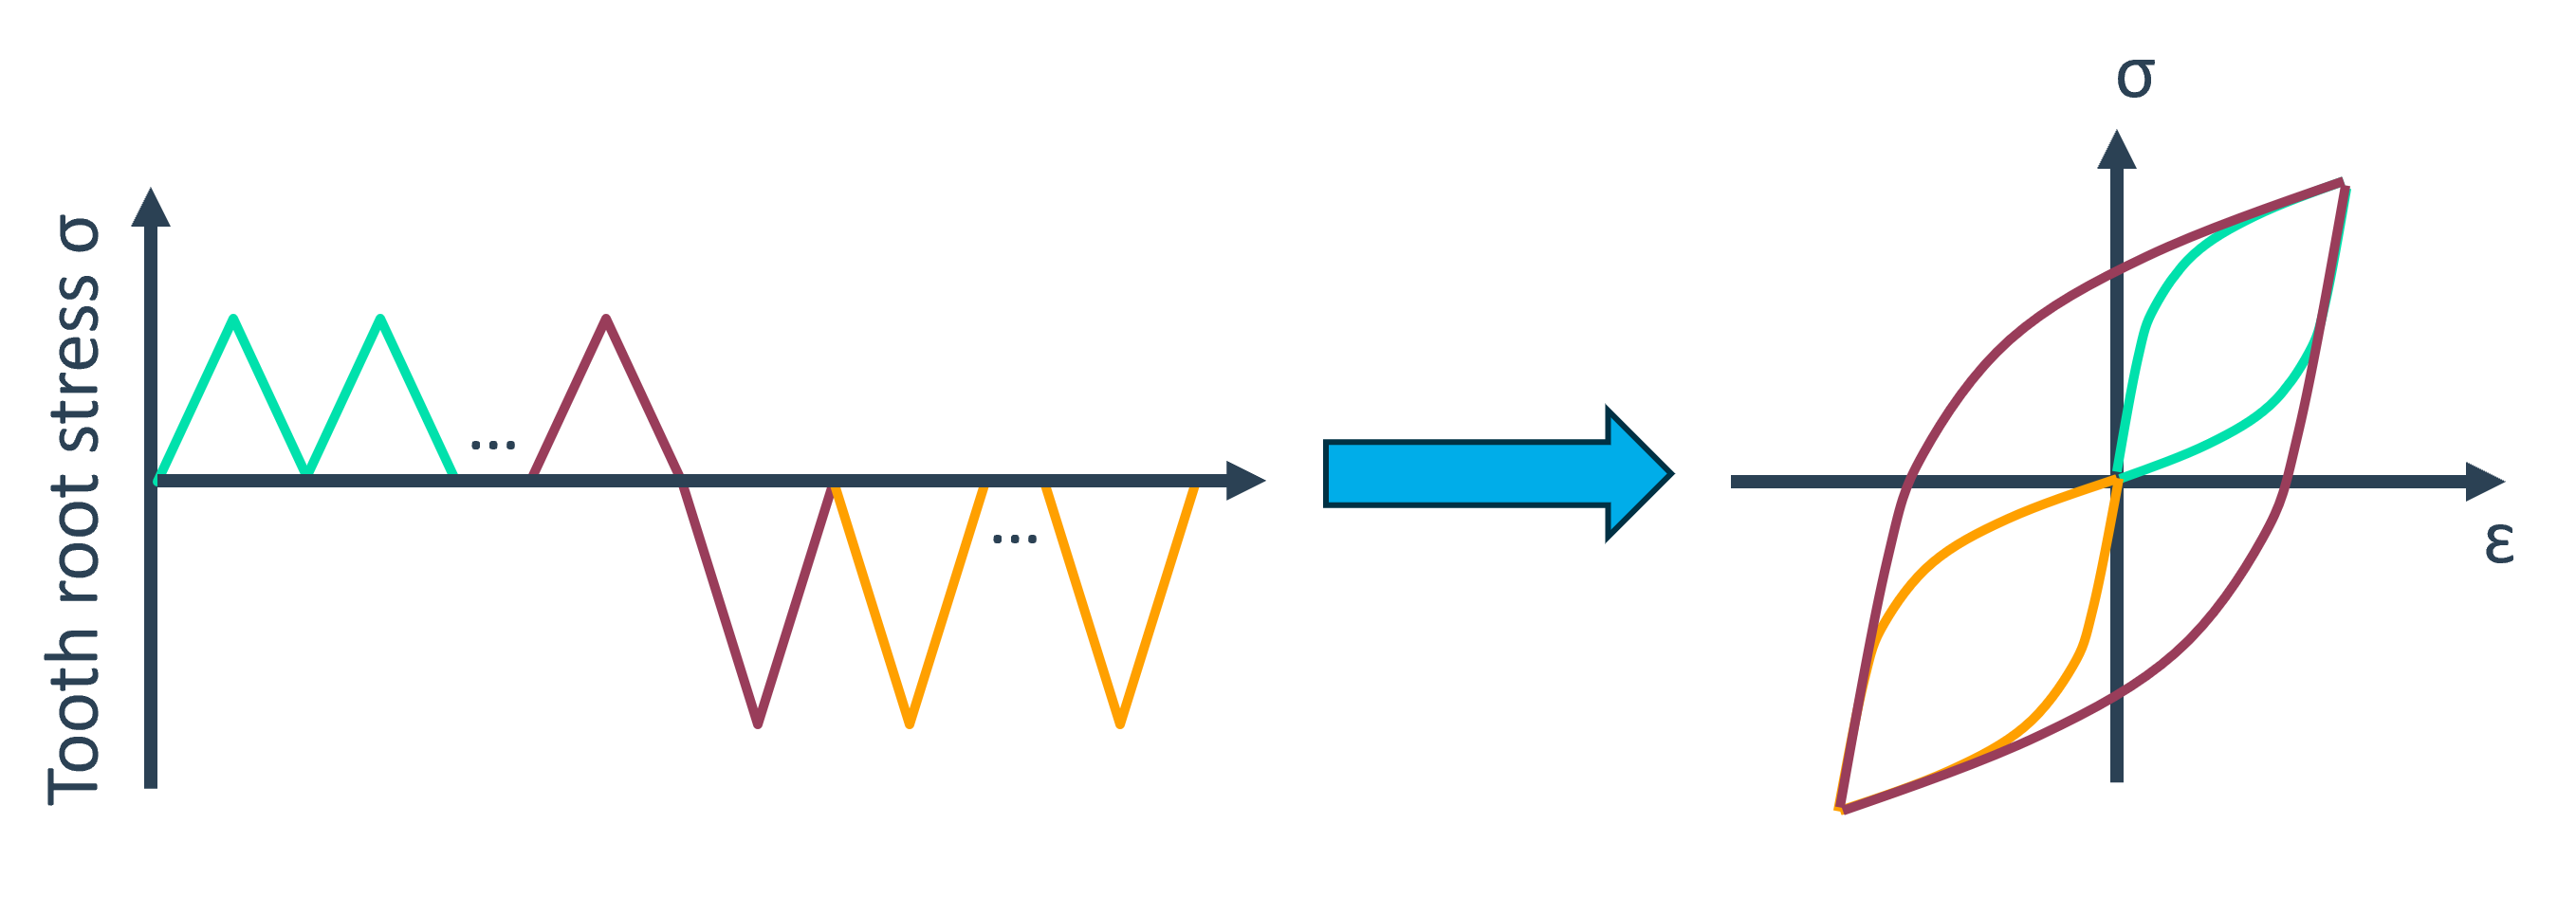
In the next step, a stress-time signal is constructed from the individual states based on the assumption that each operating state is approximately quasi-stationary. It should be noted that Rainflow requires only the sequence of discrete reversal points, not the full “high-resolution” signal. Therefore, the stress segment of each operating state is simplified and filtered so that only the reversal points remain. This reduction aligns with the core of the Rainflow interpretation based on stress-strain hysteresis: the relevant information for counting closed loops is the sequence of reversal points.
This simplified reversal point segment is then repeated to ensure that each operating state has the correct duration. The number of repetitions n is determined by the duration of the operating state and the corresponding rotational speed, essentially reflecting the number of effective full rolling cycles or meshing events within the time period. This is particularly relevant for cylindrical gears, as the load repetition at the tooth root is closely tied to the rotation. In practice, this ensures that short but more frequent states are treated differently in the time series compared to longer states with a lower repetition count.
Finally, the generated segments are assembled in the order of the generated state sequence. The result is a representative stress-time series for an evaluation point at the tooth root of a cylindrical gear.
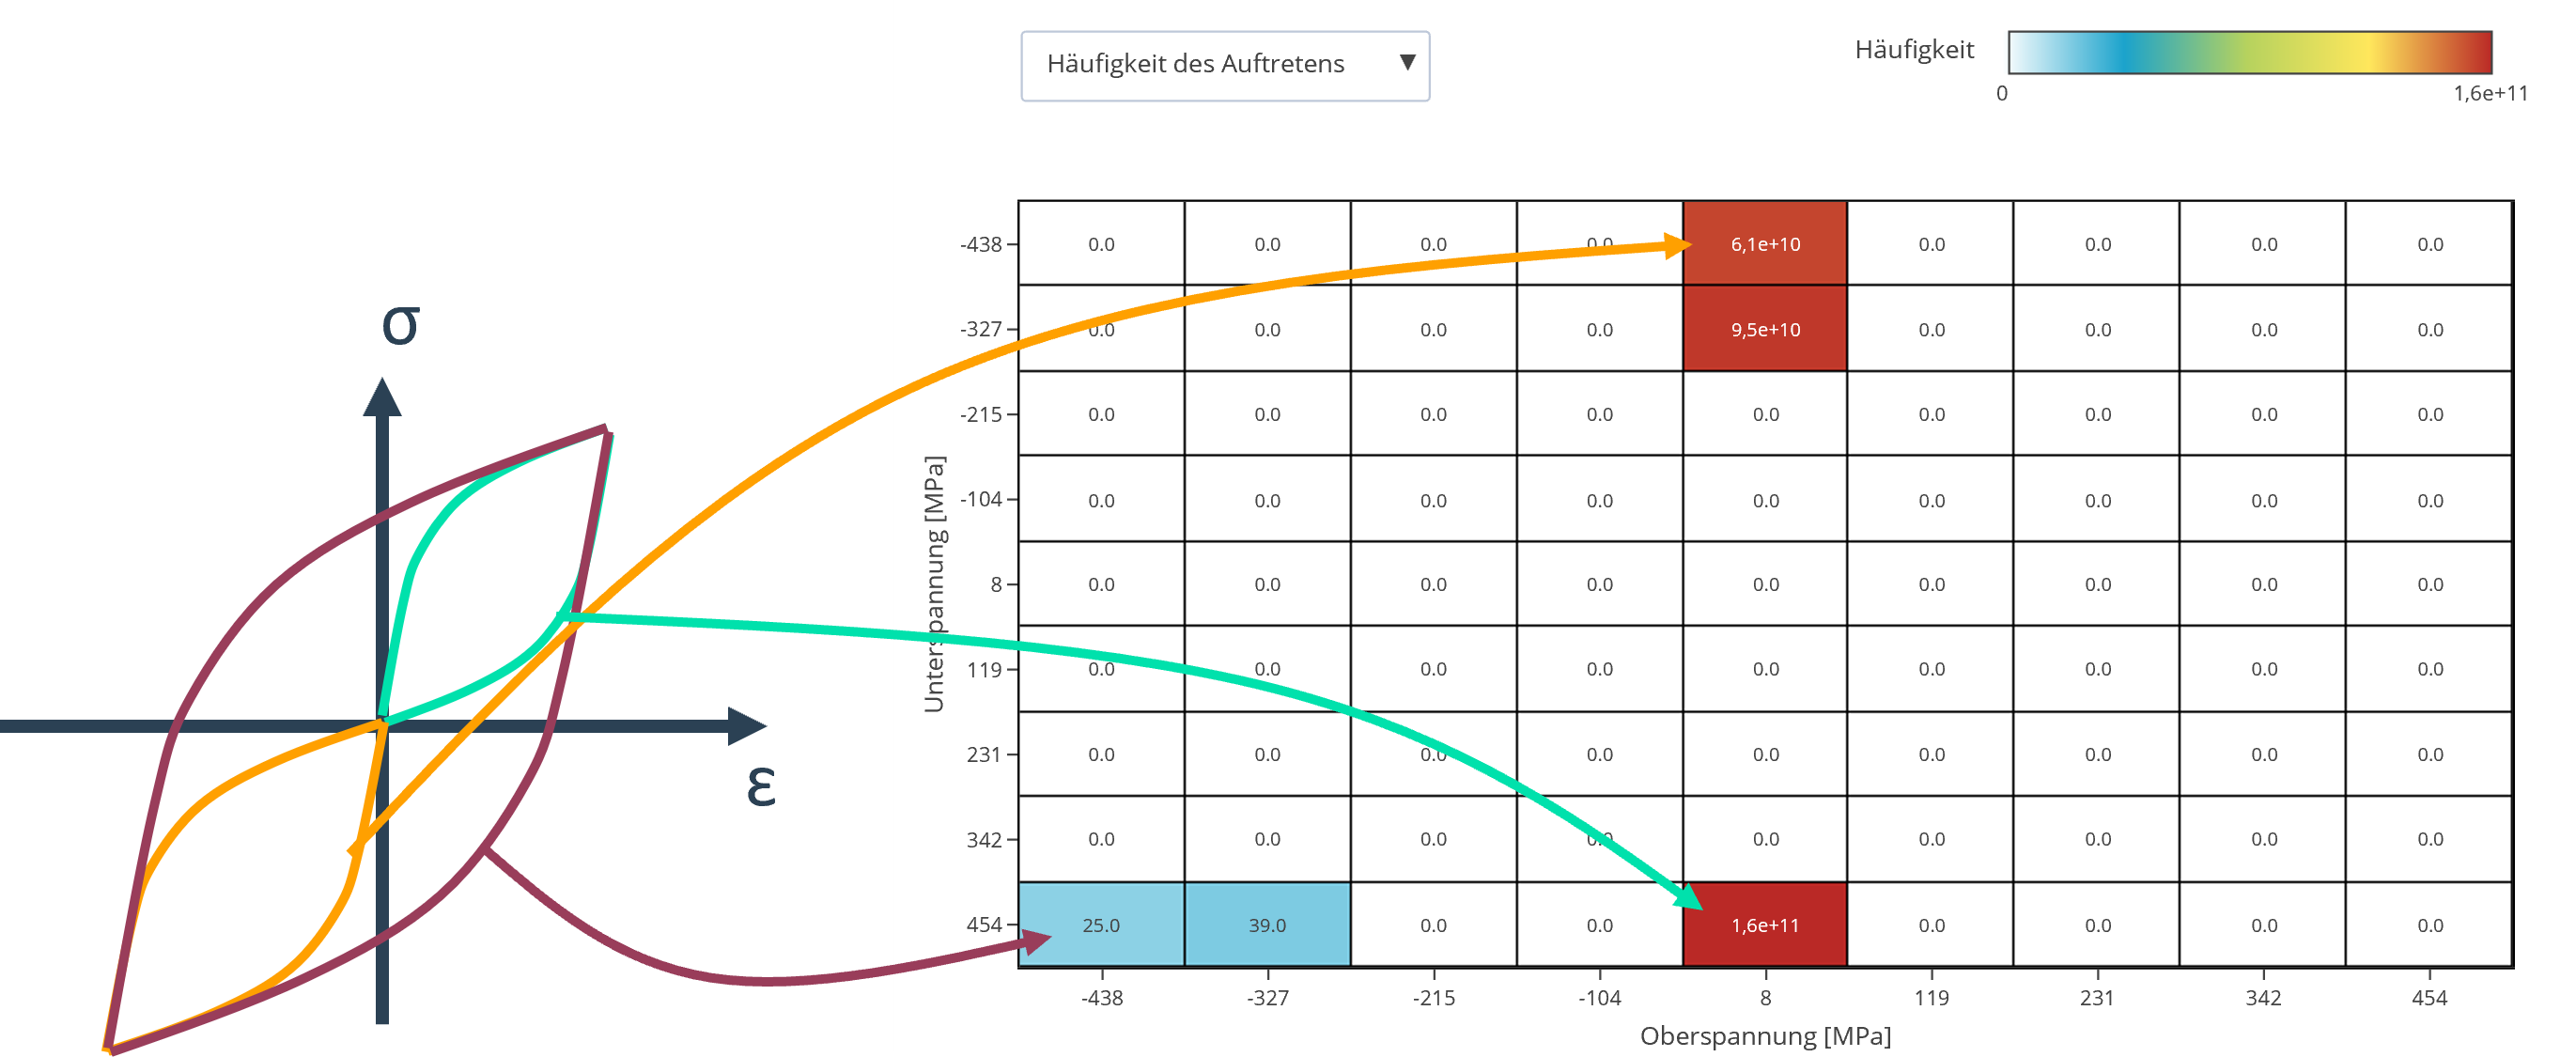
Rainflow counting is performed for this sequence using the 3-point algorithm by Clormann and Seeger [Clor 86], which provides a clear, intuitive interpretation of the cycles in the stress-strain hysteresis of the material. The result is a stress Rainflow matrix for each tooth flank that contains the counted cycles in a classified form.
The counted cycles are stored in a Rainflow stress matrix, which contains the upper and lower reversal points σo and σu for each cycle. The amplitude σa and mean stress σm can be directly determined from this matrix. This is key to the method, as it provides a link to the mean stress transformation.
Mean stress transformation in the Haigh diagram
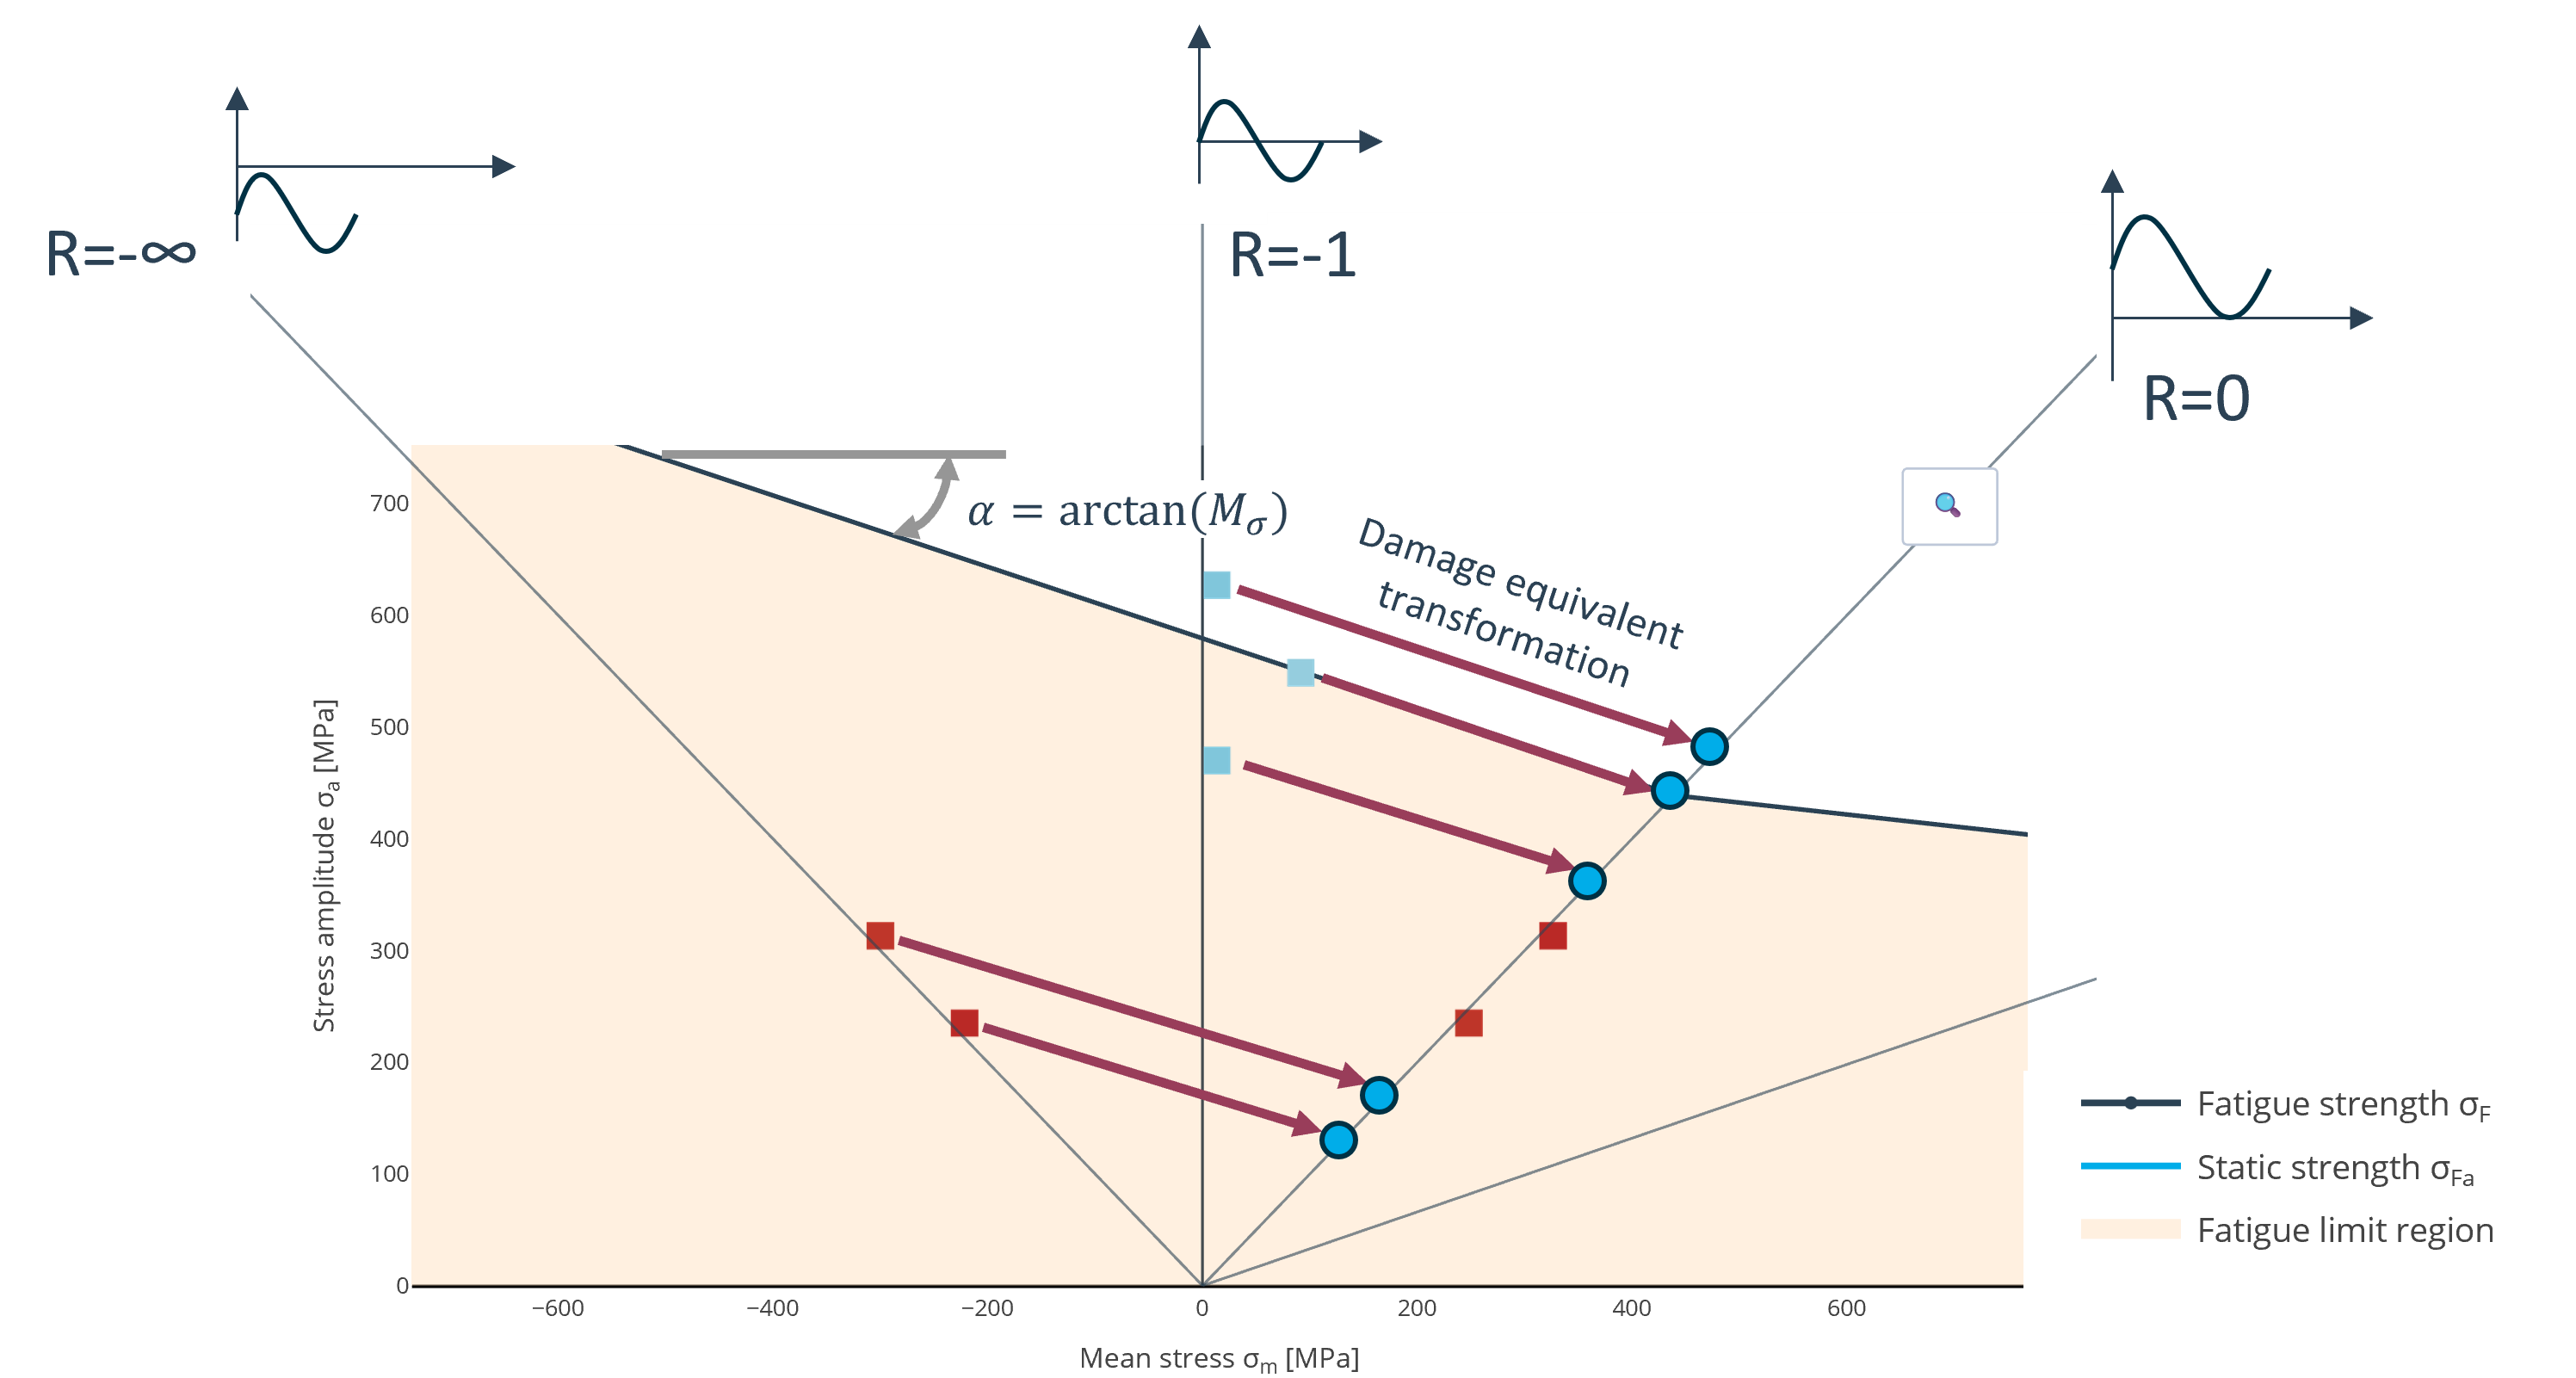
Cycles are typically evaluated using a linear damage accumulation against a Woehler S-N curve. However, this is only directly valid if the cycles and the Woehler curve have the same load ratio R. For gears, Woehler curves typically use R = 0, representing cyclic loading. This is because a pulsator is traditionally used to determine the material strength parameters. However, the cycles in the Rainflow matrix typically use R ≠ 0, as the actual loading includes mean stress and sign changes. Therefore, the counted cycles must be transformed to R= 0 for damage equivalence before evaluation.
This principle can easily be explained using a Haigh diagram, which plots the stress amplitude against the mean stress. Each Rainflow-counted cycle can be represented as a point (σm, σa ).The mean stress is then graphically transformed along a line whose slope is described by the mean stress sensitivity M. The cycles are shifted in parallel until the target stress ratio R = 0 is achieved. The equivalent amplitude for R = 0 can be derived from the shifted point. This procedure corresponds to the equivalent stress calculation, which is used in a similar form in the FKM methodology.
The stress ratio for each cycle in the Rainflow matrix is initially reconstructed from the reversal points using the mean stress σm, amplitude σa, and frequency n. Since σo = σm + σa and σu = σm- σa , it follows that:
A correction factor KAK is then calculated as a function of R, σm, σa, and the mean stress sensitivity Mσ. This is defined linearly for each segment:
This factor is first used to divide the amplitude and convert it to an equivalent level as follows:
This step converts to R = -1, representing alternate loading. An additional step is required for gears, as the reference Woehler curve corresponds to R = 0. Accordingly:
An additional conversion is performed:
The frequency (n) of each cycle is unchanged and, together with the converted amplitude, is transferred into a classical stress-amplitude collective.
In the FVA-Workbench, the mean stress sensitivity can be determined in four ways:
FKM Guideline (based on tensile strength and material group)
ISO 6336 (based on heat treatment and material group)
FVA 109 I (based on relative support number and heat treatment)
User specification, based on test results or empirical values
Damage accumulation according to ISO 6336
The Rainflow count and mean stress transformation are used to generate a classical stress-amplitude spectrum with associated frequencies, which is used for a local linear damage accumulation. Since the Woehler curve is formulated as range-based (or "double-amplitude") in ISO 6336, it is adapted to an amplitude-based Woehler curve. To do so, all stresses in the Woehler curve are halved to represent "single amplitudes" instead of "double amplitudes." As a result, the damage sum can be locally determined for the tooth root area, including cases where both tensile and compressive components are both relevant. This is particularly important for alternating load directions or load sequences with significant mean stress levels, as these conditions produce stress states that would be underestimated in a purely tensile-side evaluation.
Literature
[1] Fischer, R.; Hück, M.; Köbler, H. G.; Schütz, W.: Eine dem stationären Gaußprozess verwandte Beanspruchungs-Zeit-Funktion für Betriebsfestigkeitsversuche. Fortschritt-Berichte VDI-Z Reihe 5, 1977
[2] Clormann, U.; Seeger, T.: Rainflow-HCM. Ein Zählverfahren für Betriebsfestigkeitsnachweise auf werkstoffmechanischer Grundlage. Stahlbau 55(3), 1986
[3] Brinck, P.; Michaelis, K.; Rettig, H.; Winter, H.: FVA 109: Zahnfußfestigkeit bei Wechsellast, 1989